According to a study by BearingPoint, over 50% of companies have already implemented projects and over 75% are currently working on the topic. At the same time, almost all respondents say that the potential is far from exhausted.
Why is it that the potential has not yet been exhausted?
The question is whether the implementation makes full use of the technological possibilities. Pure dashboards based on statistical models are usually not a game changer and do not completely revolutionize the company's work. Rather, they are the basis for making a real difference with intelligent models.
First of all, it is important to understand what companies expect from the introduction of predictive maintenance systems:
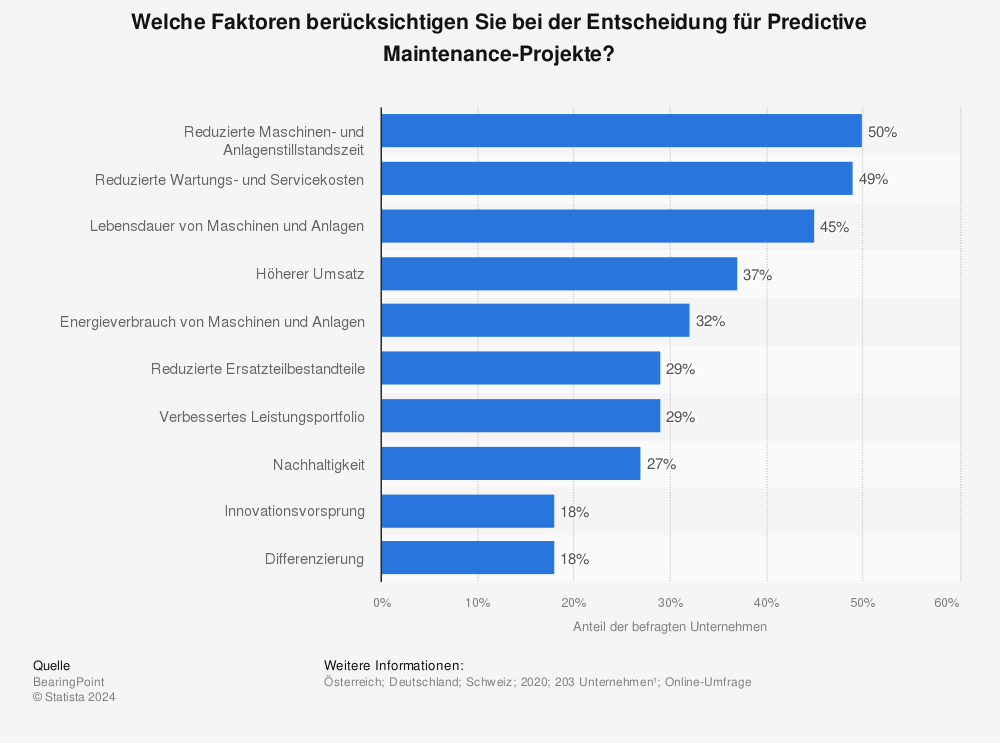
The dominant criteria for the introduction of predictive maintenance systems are the reduction of costs (through the optimization of maintenance costs and the extended service life) and the reduction of downtimes. The models developed should therefore focus on these criteria.
Statistical methods as a basis
The basis of every predictive maintenance system is data from a wide variety of sensors. This data is generally difficult to obtain, as heterogeneous as the machinery itself and not standardized. At the same time, the frequency of data updates often varies.
The first step must therefore be to harmonize this data. The representation of a machine with all its data points is often referred to as the digital twin of the machine. The different data converge at a central point and are harmonized for use and brought into a common schema.
What most dashboards now do in the first step is to visualize the recorded data for a machine as a function of time. The measured values are therefore placed in a temporal context in various diagrams and combined in different ways. The initial aim is to detect indications of anomalies and to identify indications of the occurrence of these anomalies in the time "before" so that it is possible to react to impending problems at an earlier stage in the future.
If it goes beyond pure dashboards, models are usually used to calculate statistical deviations. Hard and soft thresholds for the deviation from the optimum value (healthy state) can be defined for each sensor value, from which information for decisions can then be derived.
At best, repeating patterns can provide indications of necessary changes to thresholds.
Problems with purely statistical models & dashboards
Unfortunately, systems that focus on visualizing and observing statistical deviations are often not sufficient in reality:
The error chains in machines are so complex that they cannot be represented by a single sensor and its temporal values alone. It is often the combination of a variety of sensor data that indicates an anomaly that is actually relevant. A threshold on a single sensor without dependence on other values can even lead to more work, because deviations that are recorded at individual sensor level can lead to messages that have no real effects at all.
The difficulty in visualizing and identifying dependencies between the individual sensors in individual dashboards also means that the visualization is often not sufficient to perform a complete root cause analysis. The dependencies between the various sensors can hardly or not at all be identified.
Thresholds must be re-evaluated frequently. If environmental parameters change, learned historical dependencies and thresholds may be incorrect and the previously valid rules for decisions become obsolete.
The learned rules have to be developed anew for each machine. Every small change ensures that generalization is hardly possible. However, since the development of the models must also be allocated to the maintenance costs per machine, one of the most important objectives - the reduction of precisely these costs - is disregarded or even torpedoed.
Improvements through the use of artificial intelligence
Thanks to the massive advances in the field of artificial intelligence, but above all thanks to the availability of a wide range of tools, methods and frameworks, various forms of artificial intelligence can be used to supplement existing tools. Of course, these tools are also fundamentally based on statistical models. However, thanks to their "intelligence", they provide better opportunities to actually achieve the economic goals from the use of data:
Retraining allows you to react quickly to changing environmental conditions. The thresholds shift automatically on a regular basis and adapt to the new environmental variables.
While classic systems attempt to map complex relationships using linear models, deep neural networks, for example, offer the possibility of using non-linear models and thus better capture complexity.
Thanks to the use of approaches such as Vapnik-Chervonenki's Dimension Bounds, a newly added sensor does not bring chaos to the system, but rather improves the accuracy of data recognition.
To improve and automate the root cause analysis, the SHAP Feature Importance approach can be used, for example. This predicts how the change in a value (feature) affects the other values in the same line (at the same point in time). In this way, each individual sensor value can be retrospectively evaluated for its effect on the anomaly. The possible prediction and thus the deviation detection becomes much more accurate.
How to use artificial intelligence - Pareto before optimization
Especially for companies that have already taken their first steps in the collection and use of data using statistical models, the step towards integrating tools from the field of artificial intelligence is no longer a major challenge. Various existing models can be trained with the available data to check whether a specific model has the chance of actually generating added value on the existing data.
For widespread and scaled use, it will probably be necessary to optimize the model for your own use case later on. Nevertheless, initial added value can be achieved quickly by using pre-trained models.
The greatest economic benefit arises when the early indicators of anomalies detected thanks to artificial intelligence are incorporated into (automated) decisions and, for example, influence environmental variables in order to counteract the anomaly. In this way, the aforementioned key commercial objectives for the use of predictive maintenance systems can actually be achieved.
Predictive maintenance and artificial intelligence at mantro
In addition to using the collected data for predictive maintenance, the aim is also to create the technical basis for establishing "as a service" business models. In dynamic parts production processes, especially with small batch sizes, it is extremely important to know the machines very precisely in order to reduce set-up times and ensure optimal machine utilization. If machine and plant manufacturers move to new business models in which they no longer receive a one-off payment for a machine, but instead want to scale "as a service" in line with usage via a recurring pricing model that is adapted to the usage of the machine, they have a vested interest in preventing any downtime and maximizing machine utilization.